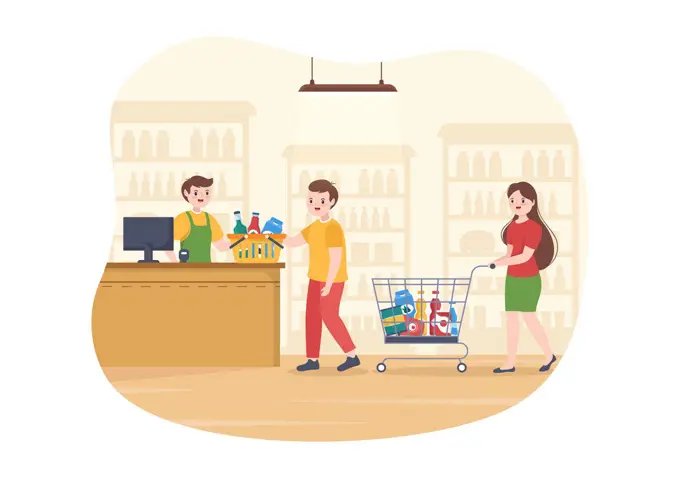
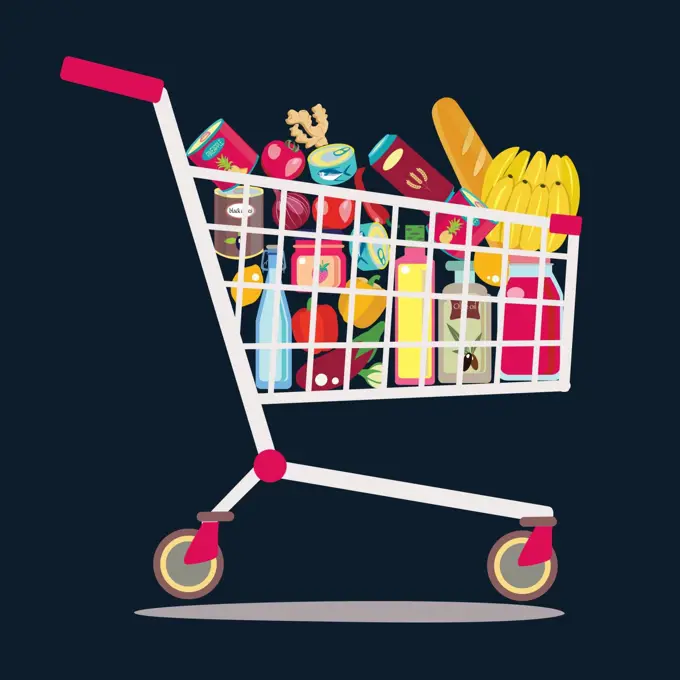
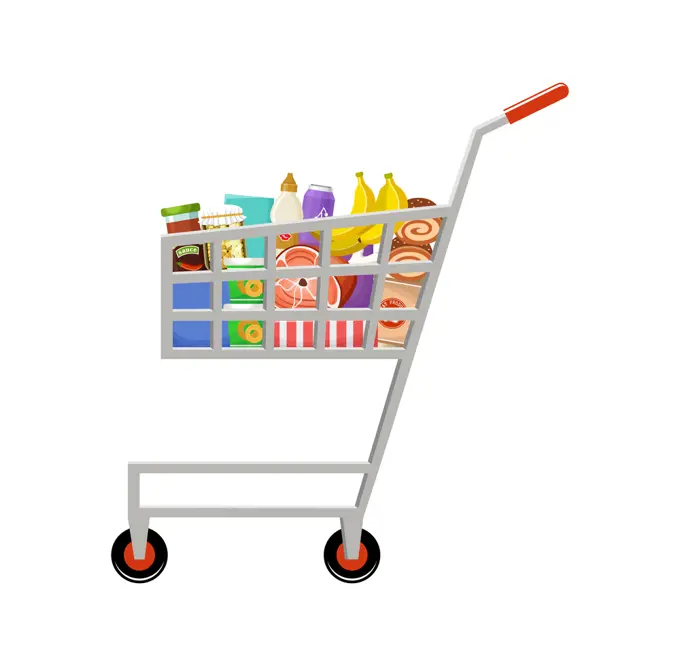
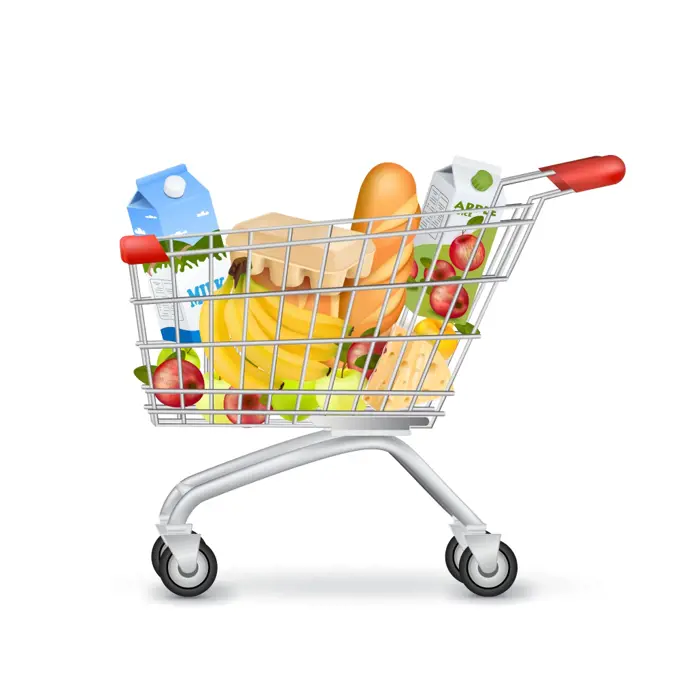
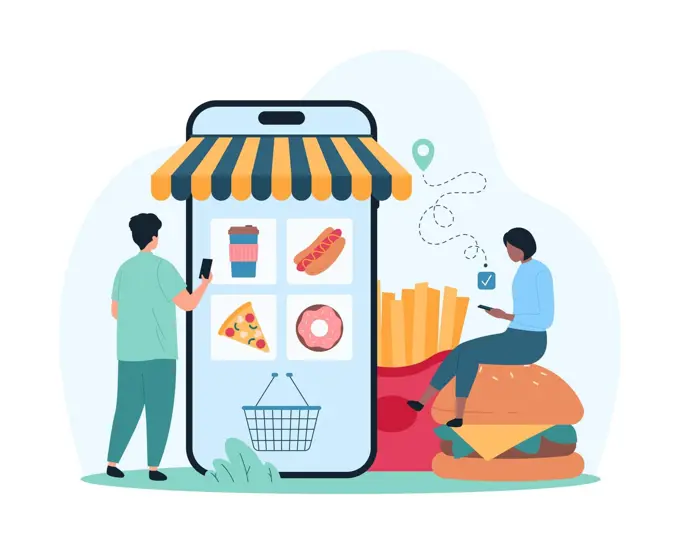
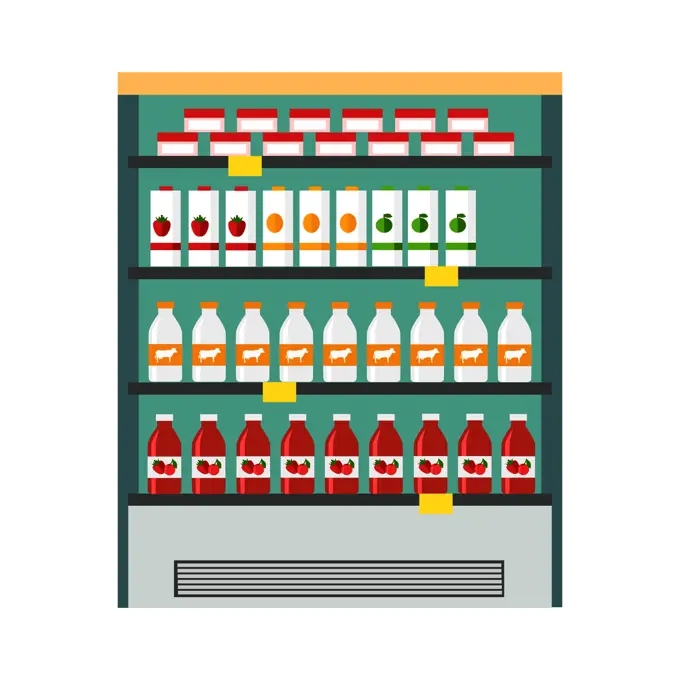
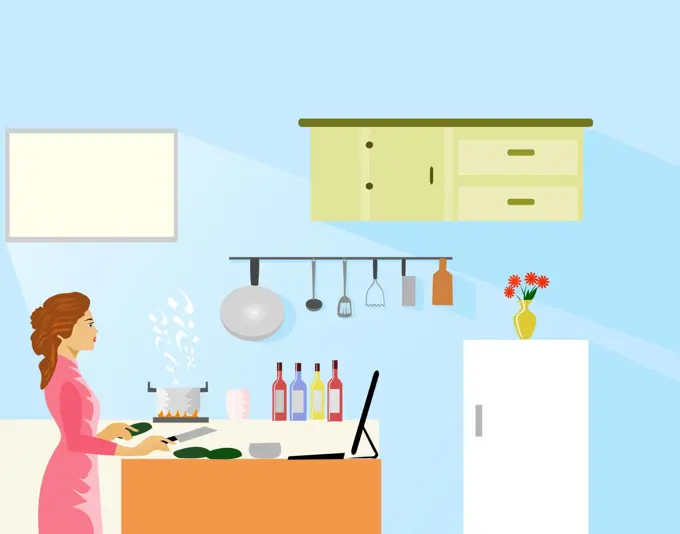
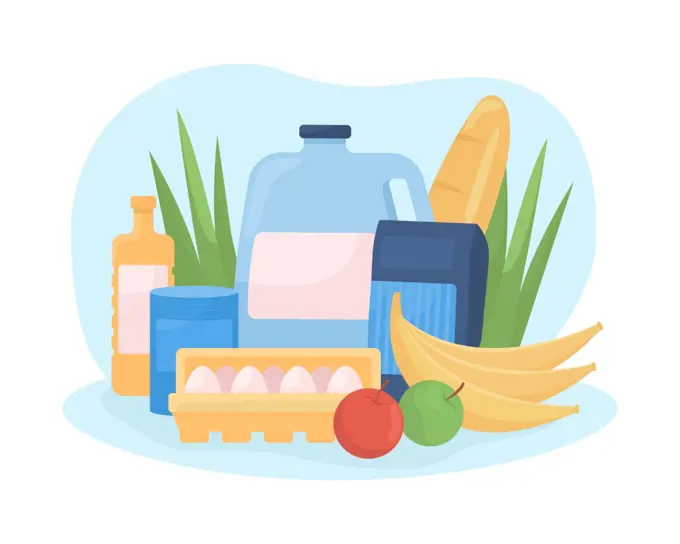
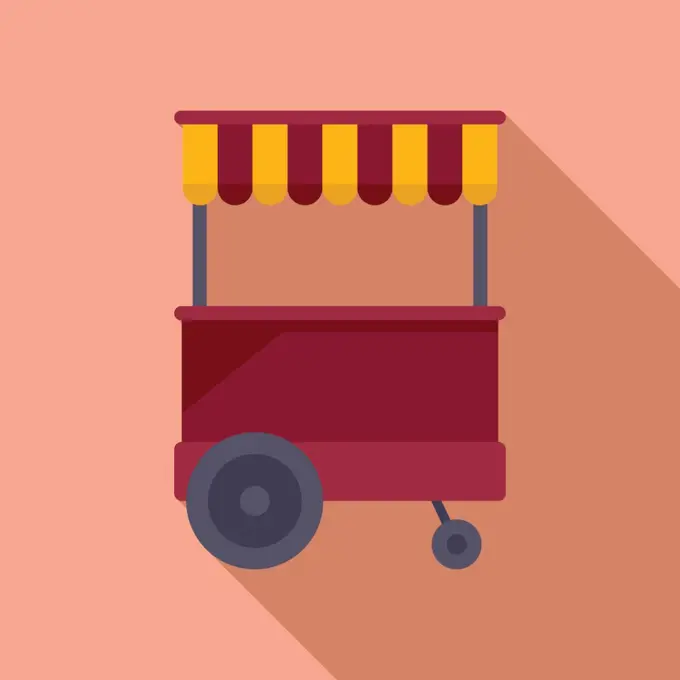
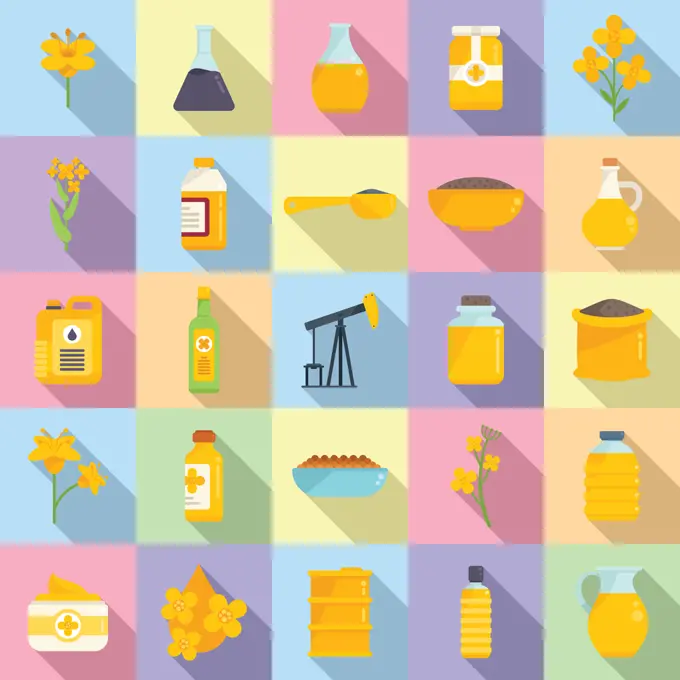
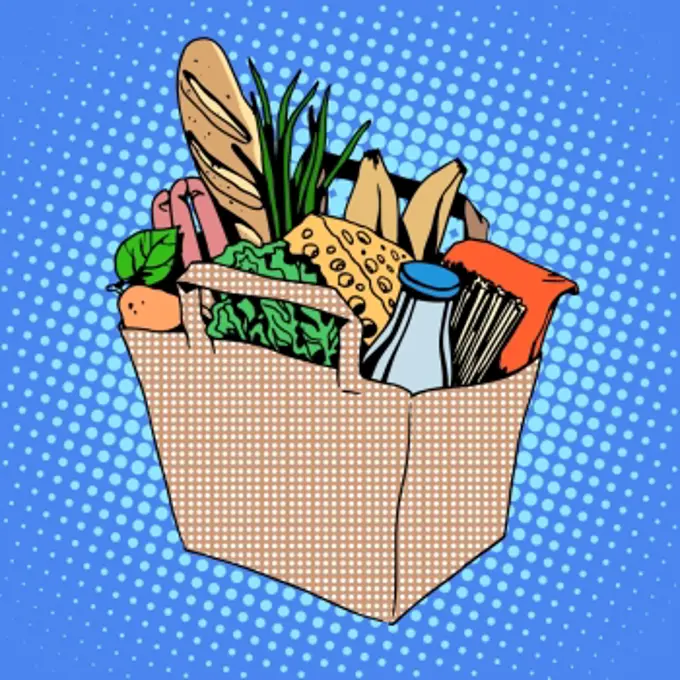
Food Production Process IllustrationsInfographics showcasing different stages of food production from processing plants to grocery store shelves, highlighting sustainability. grocery store web icons on light paper circles 137 assets in this story1525-759931411525-758325291525-197805925507-427205981525-270473605507-476754061525-238688651525-240829471525-240143175507-390716531525-270734411525-271879311525-574142285507-598331541525-272984011525-247227071525-663989221525-243811301525-257983731525-243267561525-758488301525-264189201815-630472461525-758325251525-239337111525-274032885507-448419521525-758129131525-758129095507-511081381525-268862721525-274507121525-204191011525-282246091525-227514021525-240908691525-275214141525-757762901525-271879376188-580501031525-227179031525-758129065507-453457221525-240199111525-243266075507-345806921525-205478861525-762090675507-310720601525-263825681525-254065251525-272289086188-600677606188-684024101525-282146611525-235806075507-314925041525-280632895507-369758751525-281670251525-282804531525-281797481525-258556591525-216884051525-569669981525-239183185507-478666021525-263528011525-230206131525-215131521525-268048911525-270802001525-209016696188-676846061525-255646331525-273977221525-267384781525-249721711525-267153445507-476271841525-274385121525-282995735507-463540431525-228047376188-556696576188-681020164128R-140598211525-566195631525-650075311525-264077791525-758129011525-273997281525-270734231525-759271631525-257993191525-263717235507-601297321525-240196131525-568936241525-22075366 PREVIOUS of 2 NEXT