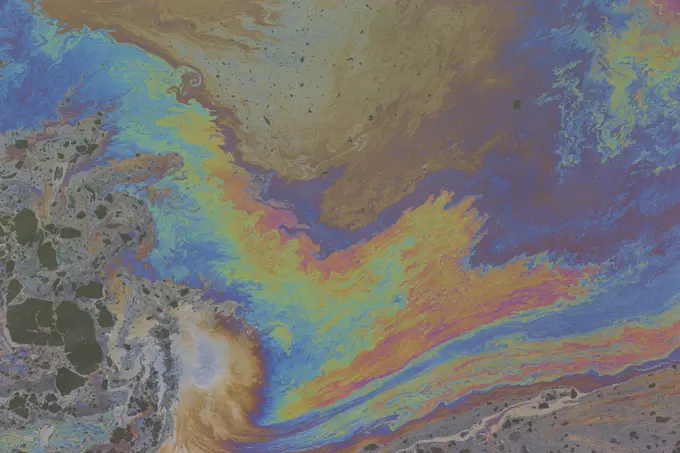
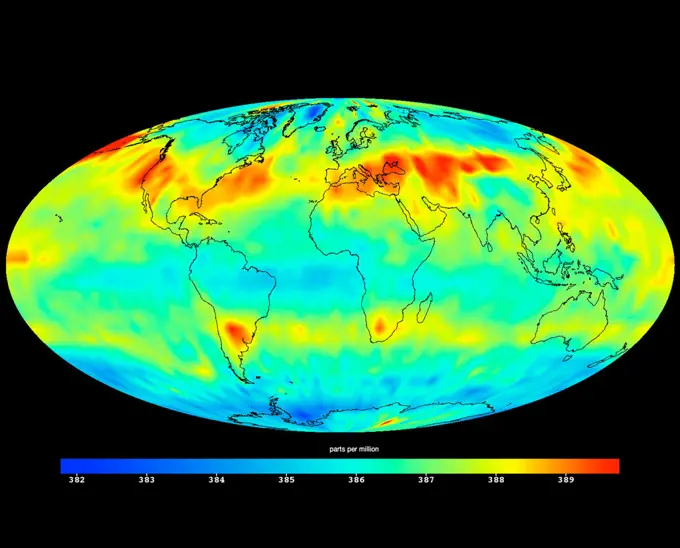
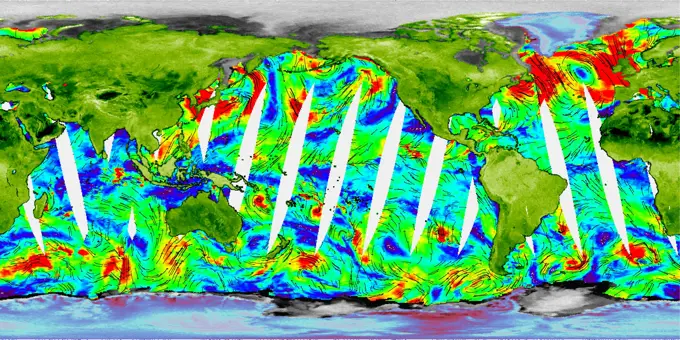
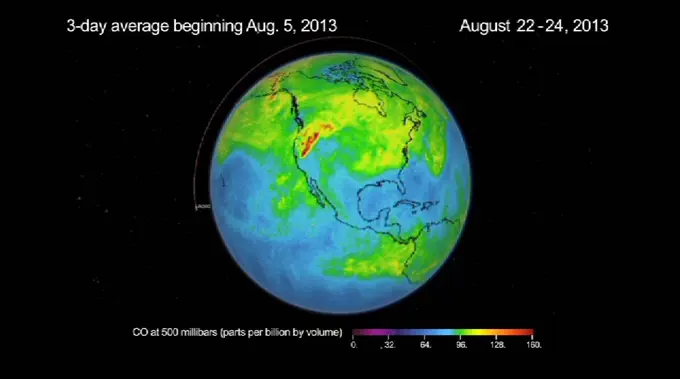
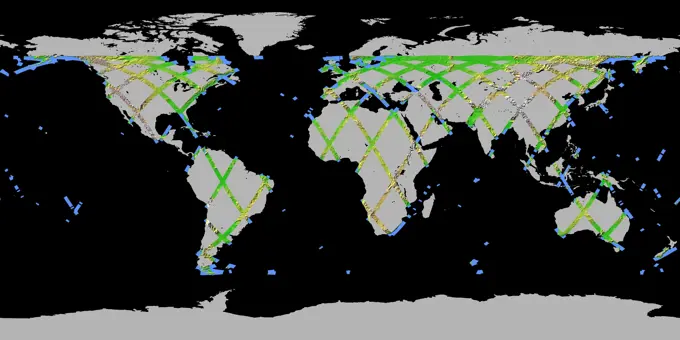
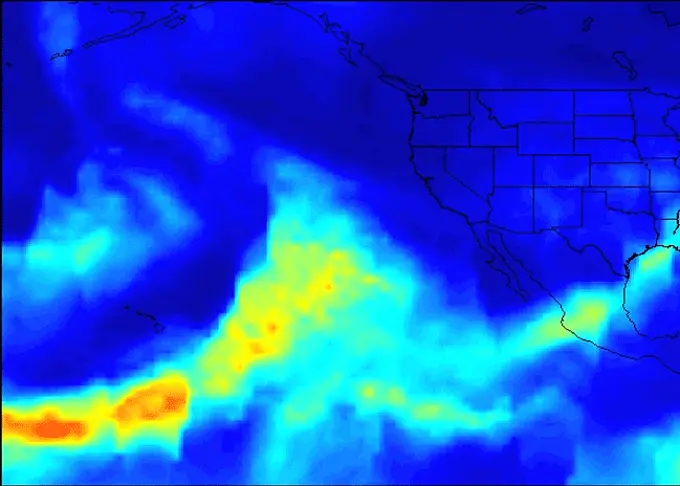
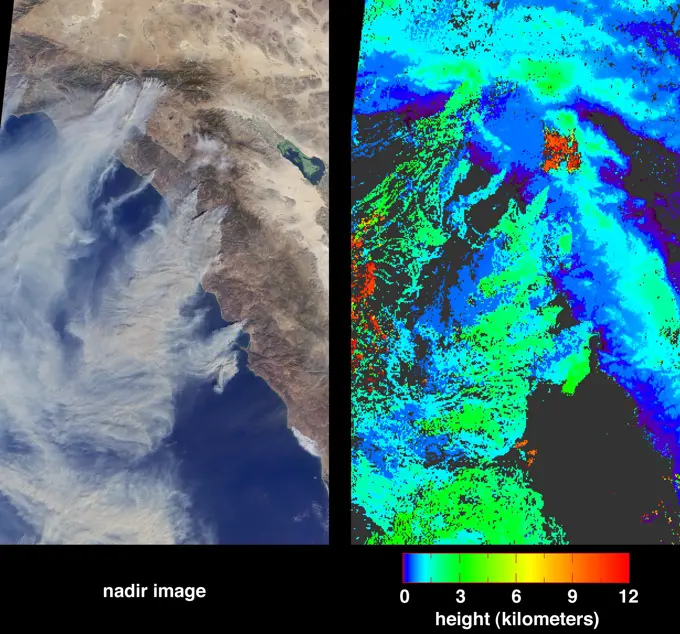
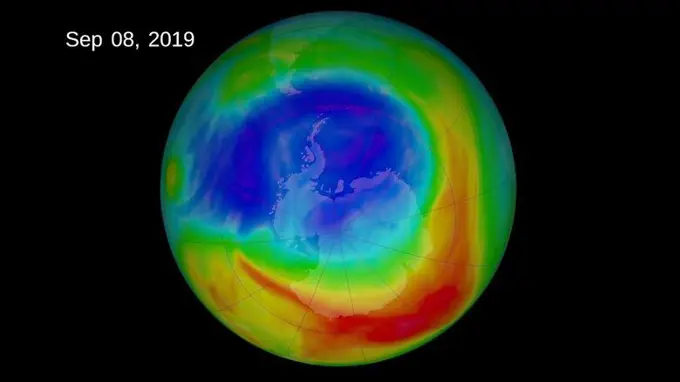
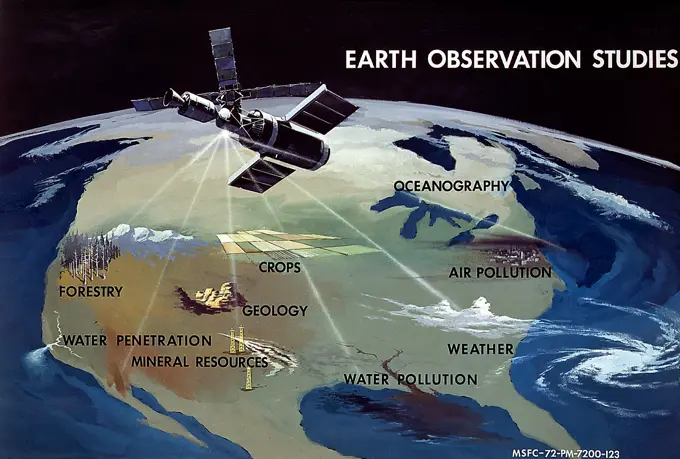
Global Environmental Data VisualizationColorful maps showing atmospheric carbon dioxide concentrations and ocean winds, derived from NASA satellites, illustrating climate patterns. Close-up of oil stains in the basin of a fishing port. 90 assets in this story1746-196638146145-445897156145-452581086145-447009306145-452321556145-445053001606-304497271899-356546145-450466746145-452604216177-V540053366177-V535472356145-449335796145-452596966145-447696516145-447942626145-447697376145-447921786145-450838546177-V536478116145-447730086145-449728536145-448157366145-529610984128R-113099256145-450995306145-444967336145-449715676145-447906476145-445016661899-354696145-449626531525-563518016145-452646226145-446815576177-V535463146177-V535471826145-451249816145-446038444409-172309846145-449715656145-452357946188-584988656145-452578826145-302533176145-445753926145-452985131746-196633206145-448455286145-449031716145-444977056145-445740646188-584994906145-452609776145-444948836188-584994136145-444849516145-446769906145-445320466188-584995626145-450430526145-445643791746-289986616145-446815566145-452589076145-449773926145-447126736145-450925626145-448783736176-552940426145-448563746145-450979916145-449034491927-16136145-452646326145-448210136145-452970234128-286810596145-446318986145-444836446145-529306026145-451551176145-452666611525-280678536145-529304076145-445147806145-546844476145-452583676145-447059616145-51995097 PREVIOUS of 1 NEXT