Fine ArtVintageFootageSubscriptionBoardsFree ResearchPricing
  • Fine Art
  • Vintage
  • Footage
  • Subscription
  • Boards
  • Free Research
  • Pricing

Satellite Oceanography Visuals

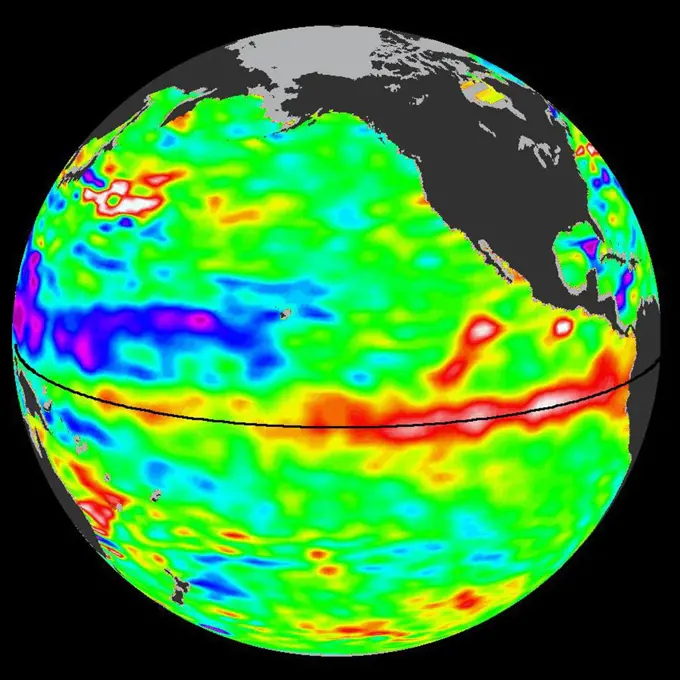
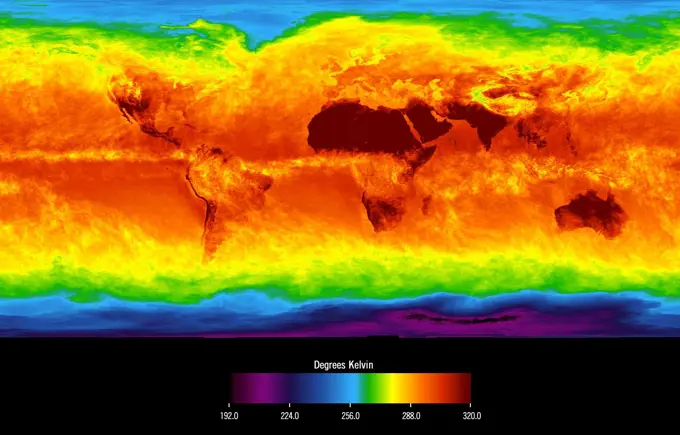
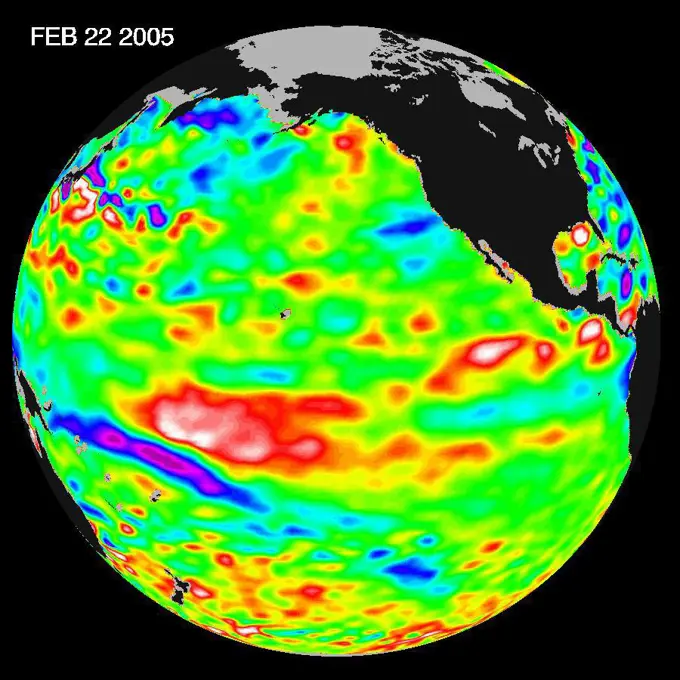
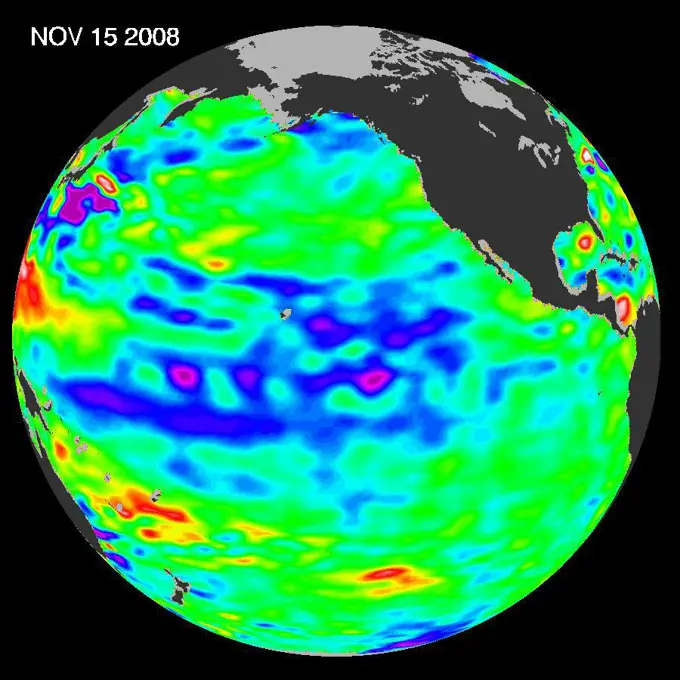
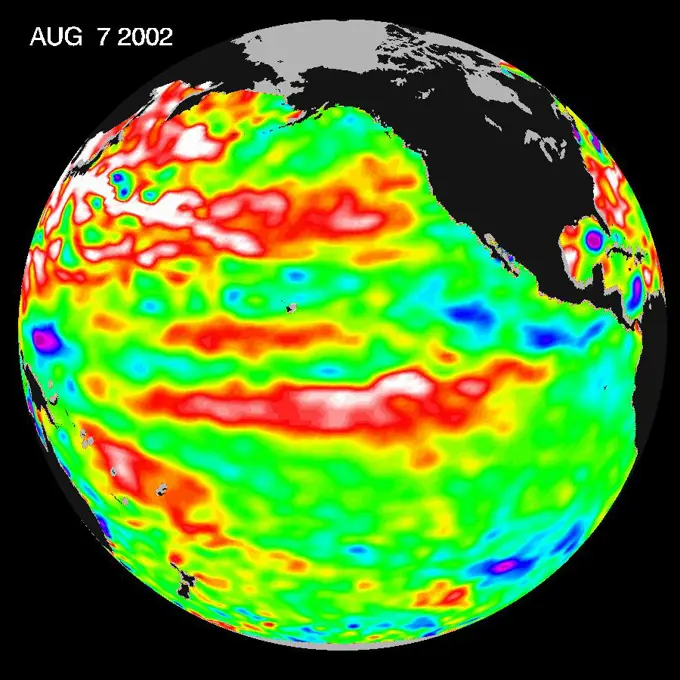
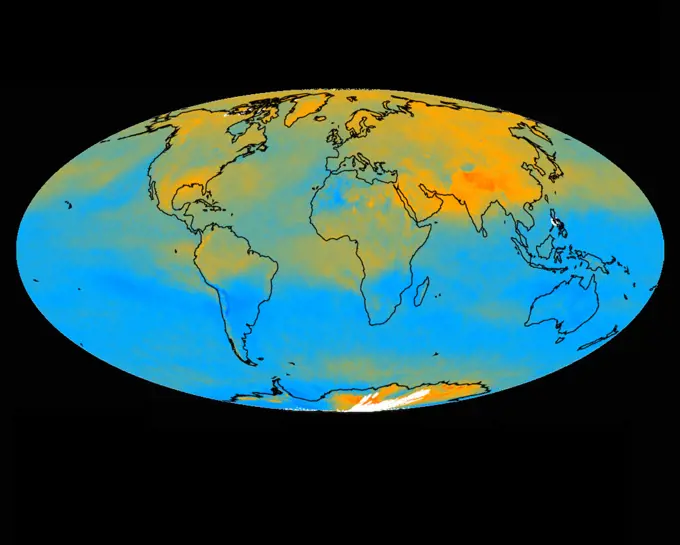
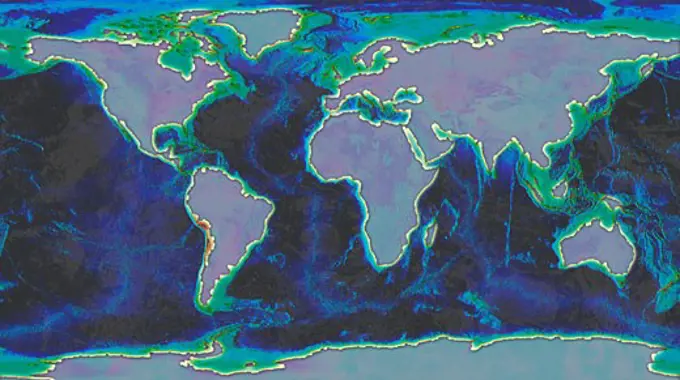
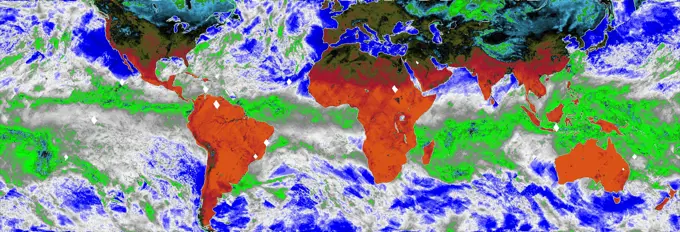
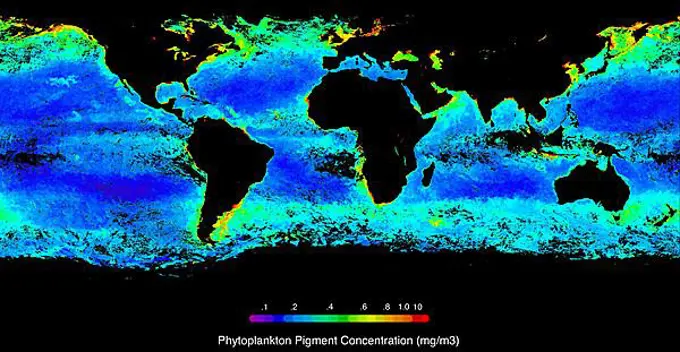
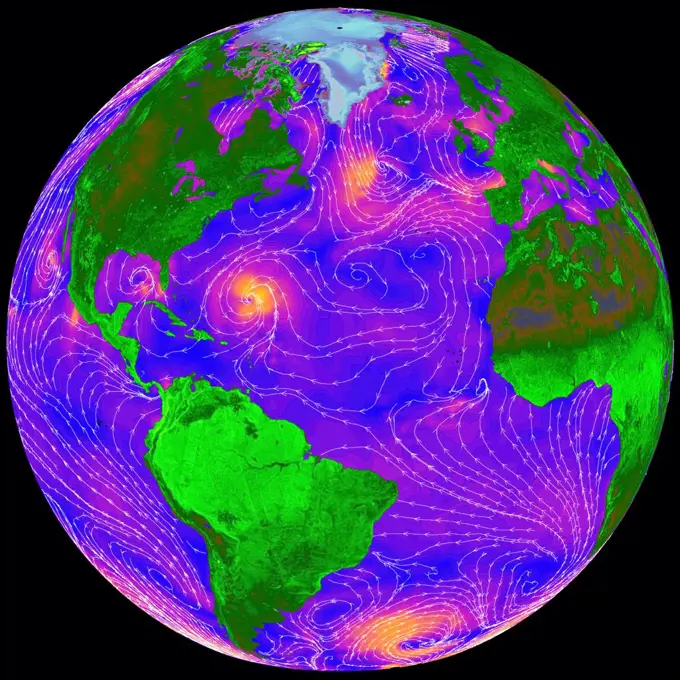
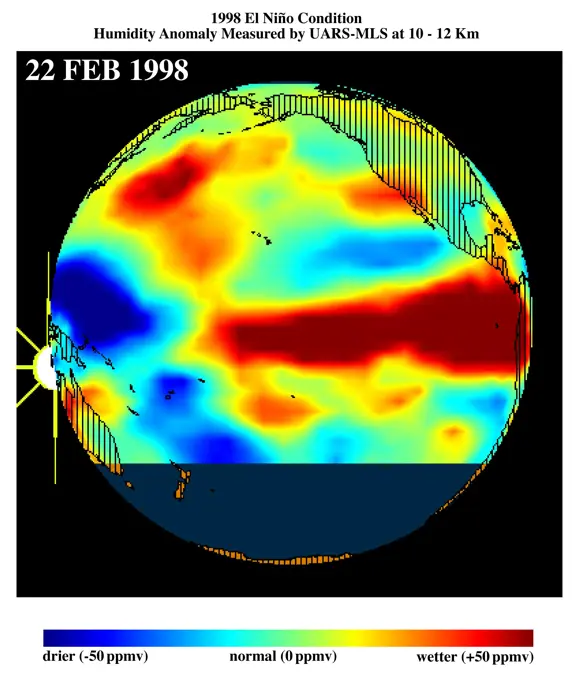
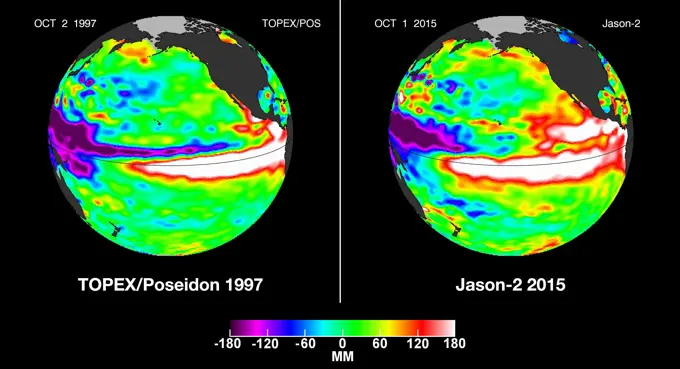
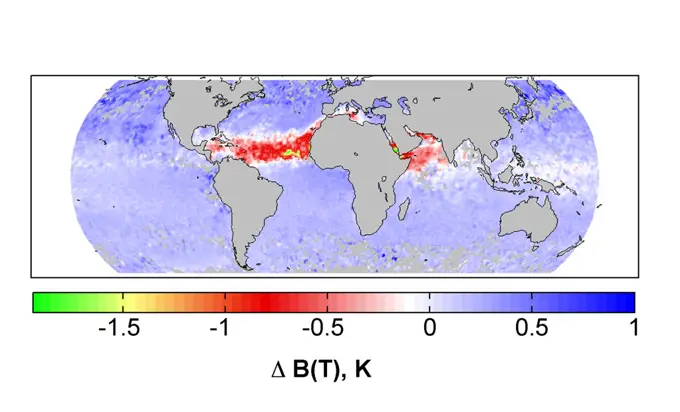
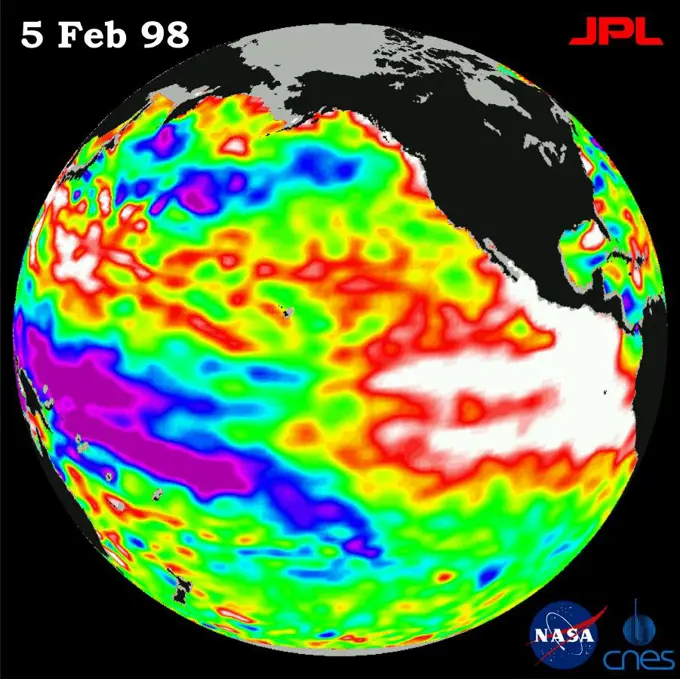
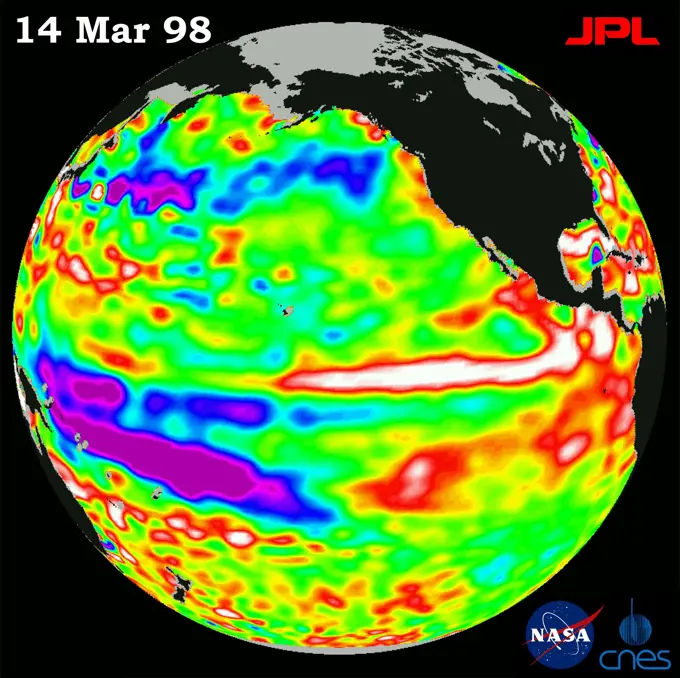
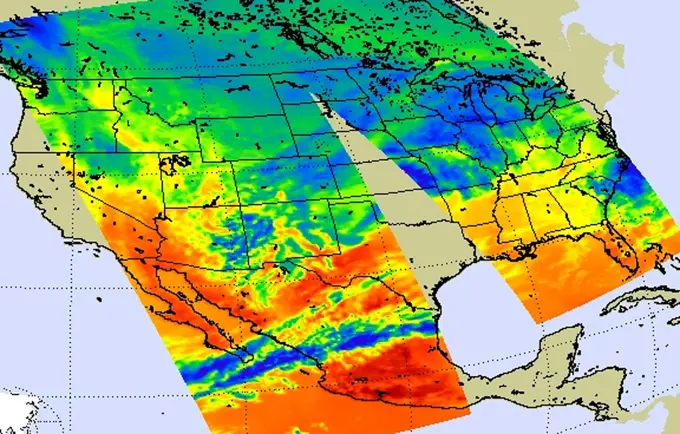
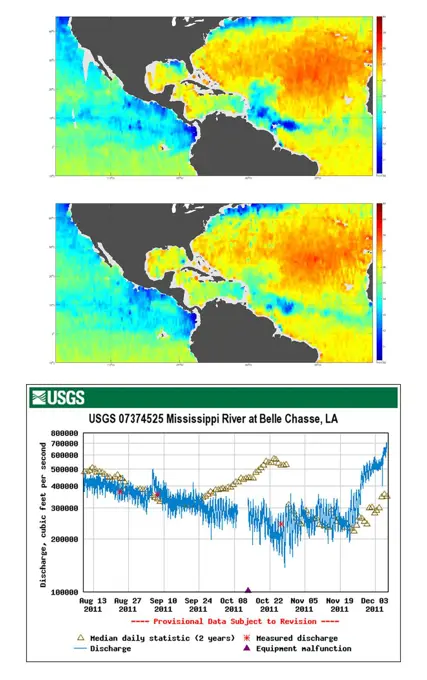
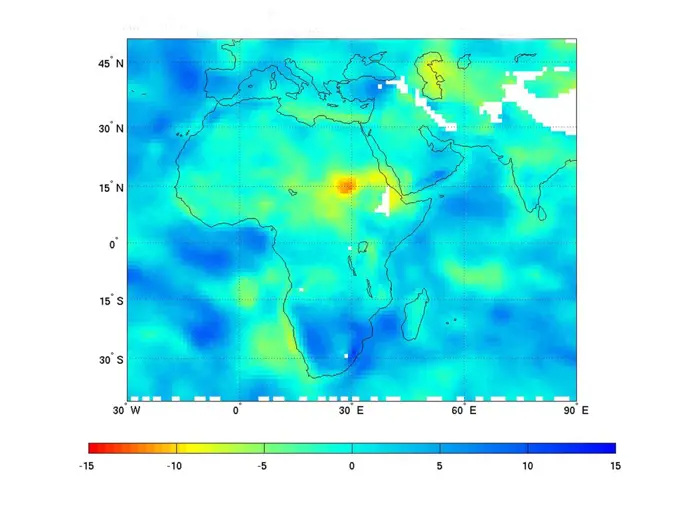
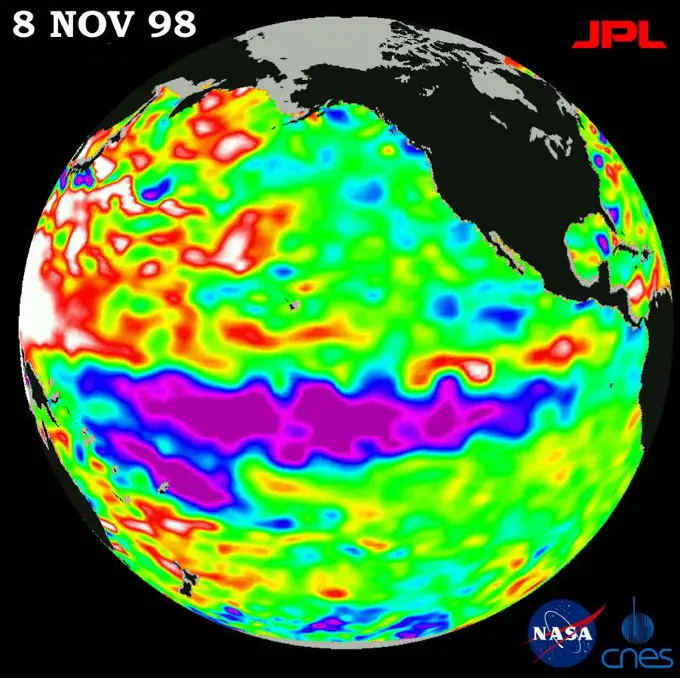
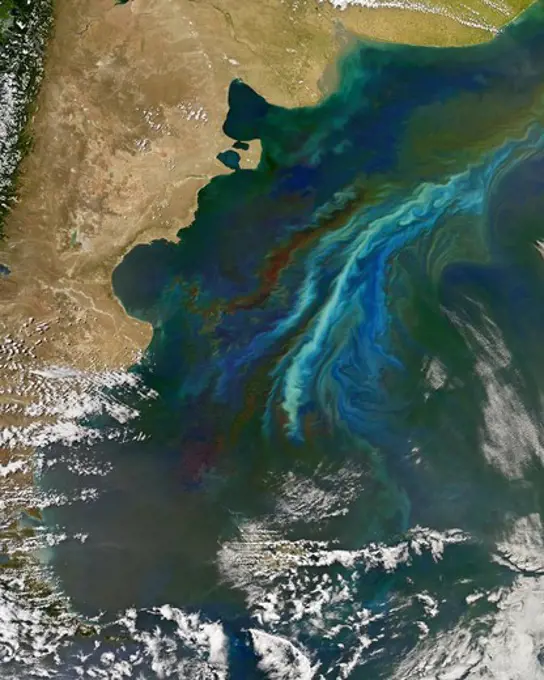
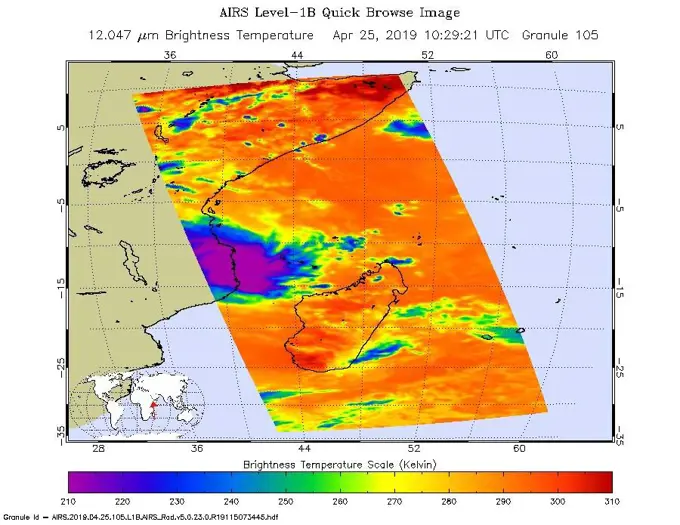
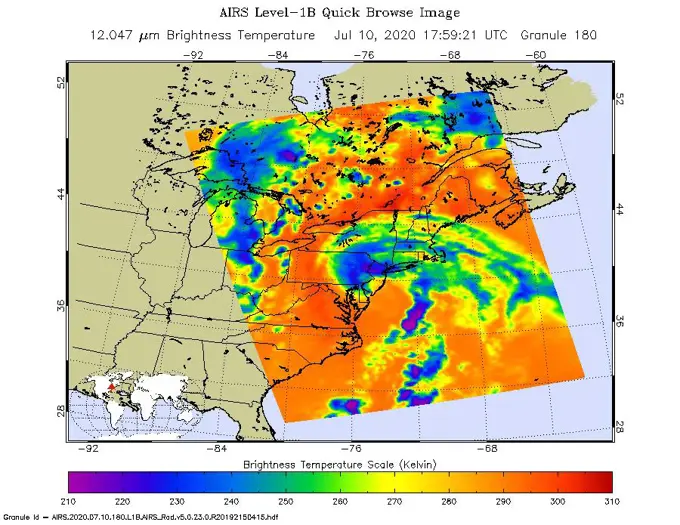
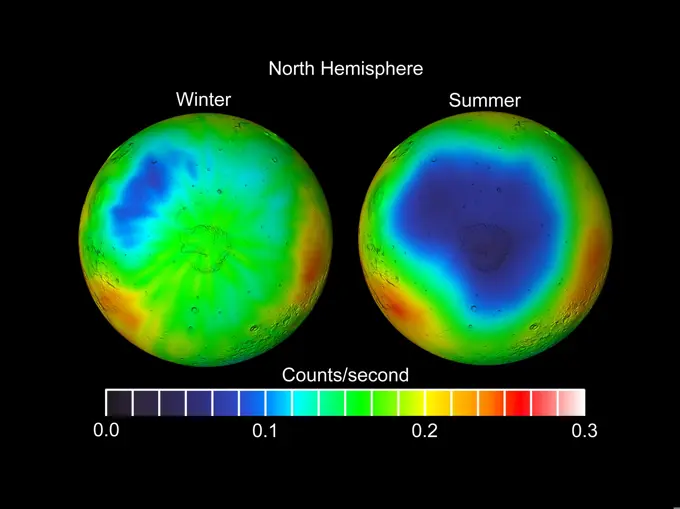
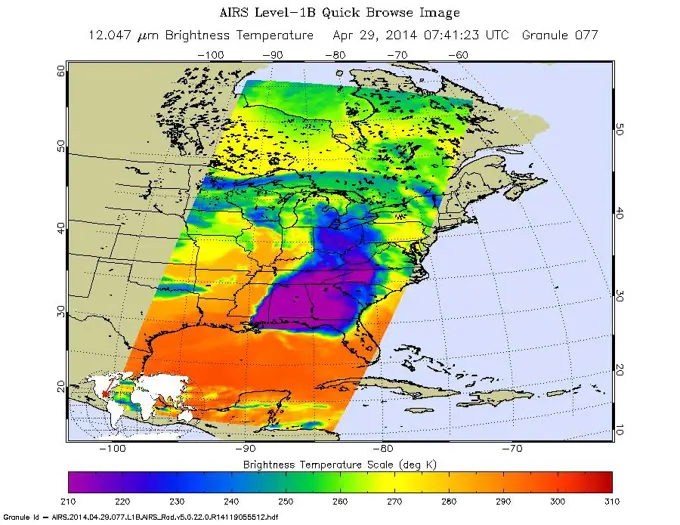
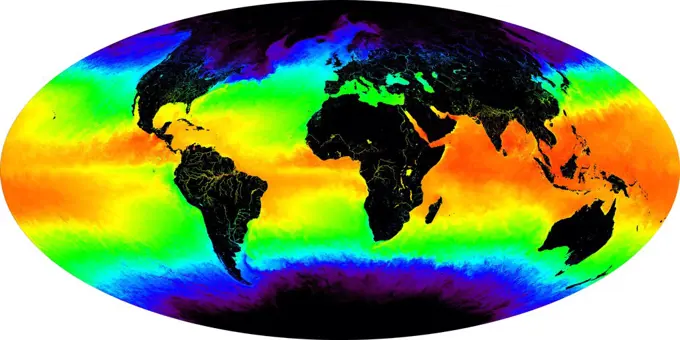
Colorful satellite data representations of ocean surface heights and pollutants, depicting global temperature variations and environmental changes.

This false-color image shows a one-month composite of sea surface temperature over the entire globe for May 2001. Red and yellow indicates warmer temperatures, green is an intermediate value, while blues and then purples are progressively colder values.
69 assets in this story
1746-19663813
Sea-level height data from the NASA/European Ocean Surface Topography Mission/Jason-2 oceanography satellite December 1, 2009 It shows a red and white area in the central and eastern equatorial Pacific that is about 10 to 18 centimetres (4 to 7 inches) above normal. These regions contrast with the western equatorial Pacific, where lower than-normal sea levels (blue and purple areas) are between 8 to 15 centimetres (3 and 6 inches) below normal. Along the equator, the red and white colours depict areas where sea surface temperatures are more than one to two degrees Celsius above normal (two to four degrees Fahrenheit).
6145-44971560
The plume of carbon monoxide pollution from the Rim Fire burning in and near Yosemite National Park, Calif., shows a three-day running average of daily measurements from NASA's Aqua spacecraft.
6145-44596623
This image shows average temperatures in April, 2003, observed by AIRS at an infrared wavelength that senses either the Earth's surface or any intervening cloud.
6145-44620978
Born in the Atlantic, Hurricane Frances became a category 4 hurricane on August 31, 2004, as seen by the Atmospheric Infrared Sounding System (AIRS) on NASA's Aqua.
6145-44629028
Recent sea-level height data from NASA's U.S./France Jason altimetric satellite during a 10-day cycle ending February 22, 2005, show that the central equatorial Pacific continues to exhibit an area of higher-than-normal sea surface heights.
6145-44745704
The latest image of sea-surface height measurements from NASA's U.S./French Jason-1 oceanography satellite shows the Pacific Ocean remains locked in a strong, cool phase of the Pacific Decadal Oscillation.
6145-44580396
This NASA Topex/Poseidon image of sea-surface heights was taken during a 10-day collection cycle ending August 7, 2002.
1746-19663848
This image is the AIRS-retrieved global tropospheric methane for August 2005. This AIRS research product will aid in the identification of natural and anthropogenic sources of this greenhouse gas, its seasonal and multi-year variation and its transport around the globe at several altitudes in the troposphere.
4239R-20480124
This false-color image shows a one-month composite of sea surface temperature over the entire globe for May 2001. Red and yellow indicates warmer temperatures, green is an intermediate value, while blues and then purples are progressively colder values.
6145-44578895
The Pacific Ocean doesn't show signs of anything that looks like the whopper El Nio of 1997-1998, according to the latest information from NASA's U.S.-French ocean-observing satellite Topex/Poseidon.
6145-44666259
A ferry carrying more than 600 passengers sank in the Java Sea between the island of Java and Borneo just before midnight on December 29, 2006, during high winds and rough seas.
6145-45041731
Shen_Nargis Snapshot of a very large simulation showing the altitude and velocity of wind speeds within the 2008 Cyclone Nargis. Top wind speeds for the storm were measured at 135 mph. The lowest altitude winds are shown in blue, while the highest altitude winds are shown in pink. Wind speed is shown by color density higher density denotes stronger winds, slightly transparent color indicates slower wind speeds.
6145-45093369
High-resolution global soil moisture map from NASA SMAP's combined radar and radiometer instruments, acquired between May 4 and May 11, 2015 during SMAP's commissioning phase.
6145-44619105
Recent sea level height data from NASA's U.S./France Jason altimetric satellite during a 10-day cycle ending June 27, 2004.
1889R-10892
World Map Illustration
6145-44483645
This map, made using the Compact Ocean Wind Vector Radiometer (COWVR) instrument's observations from Jan. 16 to 23, 2022, shows Earth's microwave emissions at a frequency of 34 gigahertz. This frequency provides information on the strength of winds at the ocean surface, the amount of water in clouds, and the amount of water vapor in the atmosphere. Green and white indicate higher water vapor and clouds, while dark blue over the ocean indicates drier air and clear sky. Typical weather patterns for January, such as tropical moisture and rain (the green band stretching across the center of the map), are visible.
6145-45258368
Hurricane Irma is the strongest hurricane ever recorded outside the Caribbean Sea and Gulf of Mexico. These two images from the Atmospheric Infrared Sounder (AIRS) instrument aboard NASA's Aqua satellite show what Hurricane Irma looked like when Aqua passed overhead just before 1 p.m. local time (10 a.m. PDT) on Sept. 5, 2017. Forecasts at the National Hurricane Center have Irma passing near the major islands to its west before turning northward near Florida this weekend. The first image (top) is an infrared snapshot from AIRS (see Figure 1 for larger image). In orange and red areas, the ocean surface shines through, while blue and purple areas represent cold, high clouds that obscure what lies below. Typical of well-developed hurricanes, Irma is nearly circular with a well-defined eye at its center. The eye is about 25 miles (40 kilometers) in diameter. Careful scrutiny shows a red pixel in the center of the eye, which means that AIRS achieved a bulls-eye with one of its looks and was
6145-44574068
The cold pool of water in the Pacific known as La Nia still persists, although it is slowly weakening, according to scientists studying new data from NASA's U.S.-French TOPEX/Poseidon satellite.
1848-49569180
Phytoplankton Ocean Map, SeaWiFS Level-3 Standard Mapped Images
6145-45266926
Almost all of Greenland continued to lose mass in May 2019 as the ice sheet continues to melt.
4239R-20480263
Armed with data from NASA's Quick Scatterometer (Quikscat), weather forecasters can now predict hazardous weather events over the oceans as much as 6 to 12 hours earlier. The direction and intensity of surface winds across the Atlantic Ocean are shown in this Quickscat image. Orange areas show where winds are blowing the hardest, while violet is an intermediate value, and blue shows relatively light winds.  In recent years, data from the Quikscat scatterometer, developed by NASA's Jet Propulsion
6145-44733978
This visualization from the Atmospheric Infrared Sounder (AIRS) on NASA's Aqua satellite shows variations in the three dimensional distribution of water vapor in the atmosphere during the summer and fall of 2005.
6145-44561785
This image shows differences in atmospheric water vapor relative to a normal (average) year in the Earth's upper troposphere about 10 kilometers (6 miles) above the surface.
6145-44685380
NASA's QuikScat satellite acquired this image of Category One Typhoon Fitow on Sept. 6, 2007, prior to the storm making landfall in Japan.
6145-44558901
This image of the Pacific Ocean was produced using sea surface height measurements taken by NASA's U.S./French TOPEX/Poseidon satellite. The image shows sea surface height relative to normal ocean conditions on Dec. 1, 1997.
6145-45099272
In this side-by-side visualization, Pacific Ocean sea surface height anomalies during the 1997-98 El Niño (left) are compared with 2015 Pacific conditions (right).
1746-19663847
The averaged brightness temperature differences between the 961 and 1231 cm-1 AIRS channels for July 2003, reveal long range transport of Sahara Dust across the Atlantic. The Atmospheric Infrared Sounder Experiment, with its visible, infrared, and microwave detectors, provides a three-dimensional look at Earths weather. Working in tandem, the three instruments can make simultaneous observations all the way down to the Earths surface, even in the presence of heavy clouds. With more than 2,000 channels sensing different regions of the atmosphere, the system creates a global, 3-D map of atmospheric temperature and humidity and provides information on clouds, greenhouse gases, and many other atmospheric phenomena.
6145-44561770
This image shows differences in atmospheric water vapor relative to a normal (average) year in the Earth's upper troposphere about 10 kilometers (6 miles) above the surface.
6145-44917633
NASA's Aqua spacecraft captured this infrared image of the first of a series of storms approaching the Pacific Northwest at 2141 UTC (1:41 p.m. PST) on Nov. 28, 2012, marking the beginning of an 'atmospheric river' event.
6145-44565870
This image of the Pacific Ocean was produced using sea surface height measurements taken by NASA's U.S.-French TOPEX/Poseidon satellite.
6145-44562585
This image of the Pacific Ocean was produced using sea surface height measurements taken by NASA's U.S.-French TOPEX/Poseidon satellite.
1889R-28139
World Map Illustration
6145-44845503
This visible image from NASA's Aqua satellite Jan. 31 shows thickening clouds along a developing intense front in the plains and Midwestern states that will produce excessive snow, freezing rain, sleet, and wind in those areas.
6145-44618627
Numerous fires occurred near the headwaters of the Xingu River and the Xingu Indigenous Peoples' Reserve in Mato Grosso, Brazil, during late June and early July, 2004, as seen by NASA's Terra spacecraft.
6145-45031332
Tropical Storm Lee made landfall over New Orleans on Sept. 2-3, 2011, with predicted rainfall of 15 to 20 inches (38 to 51 centimeters) over southern Louisiana. These charts are from NASA's Aquarius spacecraft.
6145-44639101
This figure shows the effect of the December 2004 great Sumatra earthquake on the Earths gravity field as observed by NASA's GRACE.
1746-19671260
Northeast Africa continues to reel from the effects of the worst drought to strike the region in decades.The dry conditions are illustrated in this map, created using nine years of data. 2003 through 2010.
6145-45266665
NASA's AIRS instrument imaged Tropical Storm Barry on the afternoon of July 12, 2019, a day before the storm is expected to make landfall on the Louisiana Coast. The infrared image shows very cold clouds that have been carried high into the atmosphere by deep thunderstorms in purple. These clouds are associated with heavy rainfall. Warmer areas with shallower rain clouds are shown in blue and green. And the orange and red areas represent mostly cloud-free air.
6145-45258369
NASA and its partners are contributing important observations and expertise to the ongoing response to the Sept. 7, 2017 (local time), magnitude 8.1 Oaxaca-Chiapas earthquake in Mexico. This earthquake was the strongest in more than a century in Mexico. It has caused a significant humanitarian crisis, with widespread building damage and triggered landslides throughout the region. Scientists with the Advanced Rapid Imaging and Analysis project (ARIA), a collaboration between NASA's Jet Propulsion Laboratory in Pasadena, California; and Caltech, also in Pasadena, analyzed interferometric synthetic aperture radar images from the radar instrument on the Copernicus Sentinel-1A and Sentinel-1B satellites operated by the European Space Agency (ESA) to calculate a map of the deformation of Earth's surface caused by the quake. This false-color map shows the amount of permanent surface movement caused almost entirely by the earthquake, as viewed by the satellite, during a six-day interval betwee
6145-44632987
When NASA's Quick Scatterometer (QuikScat) captured this image on July 13, 2005, Emily was just a few hours away from becoming a hurricane.
6145-44718842
A series of maps of the transport of carbon monoxide generated by Alaska Fires, July 2004, created by data from the Atmospheric Infrared Sounder (AIRS) on NASA's Aqua satellite.
6145-44570981
This image of the Pacific Ocean was produced using sea-surface height measurements taken by NASA's U.S.-French TOPEX/Poseidon satellite.
4389-2245
Plankton Bloom Off Patagonia
6145-44557576
This image of the Pacific Ocean was produced using sea surface height measurements taken by NASA's U.S./French TOPEX/Poseidon satellite.
6145-44583631
These images from NASA's Terra satellite, captured on October 18, 2002, display a large dust plume extended across countries bordering the eastern Mediterranean Sea.
6145-45261997
The latest infrared image from NASA's Atmospheric Infrared Sounder (AIRS) instrument aboard NASA's Aqua satellite illustrates the growing flood threat from now Tropical Storm Harvey. In the false-color image, acquired at 2 29 p.m. CDT (19 29 UTC) on Aug. 28, 2017, a large area of dark blue and purple centered along the southeastern Texas coast denotes the coldest cloud top temperatures and strongest thunderstorms. A second area of intense precipitation is visible over southeastern Louisiana. Harvey has reemerged over the Gulf of Mexico, but the National Hurricane Center forecasts only a small amount of strengthening before the storm moves slowly north and inland again.
6145-44689118
The scope and extent of the strong Santa Ana wind event in Southern California the week of Oct. 21, 2007, is visible in this image from NASA's QuikScat satellite.
6145-45265903
This infrared image from NASA's Atmospheric Infrared Sounder (AIRS) shows the temperature of clouds or the surface in and around Tropical Cyclone Kenneth as it was about to make landfall in northern Mozambique on Thursday, April 25. The large purple area indicates very cold clouds carried high into the atmosphere by deep thunderstorms. These storm clouds are associated with heavy rainfall. The orange areas are mostly cloud-free areas, with the clear air caused by air motion outward from the cold clouds near the storm center then downward into the surrounding areas. The images were taken at 1 30 p.m. local time. Shortly after that, Kenneth made landfall with maximum sustained winds of 140 mph (225 kph). It was the first known hurricane-strength landfall in the province and comes just weeks after Tropical Cyclone Idai hit farther south in central Mozambique with catastrophic consequences. Heavy rainfall and life-threatening flooding are expected over the next several days.
6145-45298511
NASA's Atmospheric Infrared Sounder (AIRS) collected this image of Tropical Storm Fay over New England at around 2 p.m. local time on Friday, July 10. The center of the storm made landfall about 10 miles (15 kilometers) north-northeast of Atlantic City, New Jersey, at around 5 p.m. local time, when Fay had maximum sustained winds of around 50 mph (85 kph). In the infrared AIRS image, the purple regions indicate very cold clouds lofted high into the atmosphere by the storm. These clouds are generally linked to heavy rainfall. Warmer clouds closer to the ground show up as green and blue, while the orange areas denote mostly cloud-free parts of the sky. AIRS, together with the Advanced Microwave Sounding Unit (AMSU), measures the infrared and microwave radiation emitted from Earth to study the planet's weather and climate. Both instruments observe Earth from NASA's Aqua satellite, which launched in 2002. AIRS and AMSU work in tandem to make simultaneous observations down to Earth's surfac
6145-44655241
Infrared image of Hurricane Hector in the eastern Pacific were created with data from the Atmospheric Infrared Sounder (AIRS) on NASA's Aqua satellite on August 17, 2006.
6145-44601657
The extent, height, and amount of smoke originating from the B&B Complex Fires in central Oregon are captured in these September 4, 2003 views from NASA's Terra spacecraft.
6145-45298512
NASA's Atmospheric Infrared Sounder (AIRS) was monitoring Tropical Storm Hanna as it took aim at southern Texas on July 26. Perched on NASA's Aqua satellite, AIRS is an instrument that studies Earth's weather and climate. Hanna made landfall as a Category 1 hurricane around 5 p.m. local time over Padre Island, Texas, on July 25. Since then, the storm has lost steam, weakening to a tropical storm in the early morning hours of July 26, and then to a tropical depression by the afternoon. The purple areas in the AIRS image  taken at 1 35 a.m. local time on July 26  show regions within the tropical storm with cold clouds high in Earth's atmosphere that tend to produce heavy rainfall. The National Hurricane Center predicts that Hanna will continue over northeastern Mexico, where it will dissipate by late in the day on July 27.
6145-44598228
Seasonal Frost Changes on Mars
6145-44685632
A series of fires across Greece in August of 2007 burned 469,000 acres, visualized here by the Atmospheric Infrared Sounder (AIRS) on NASA's Aqua satellite.
6145-44726870
AIRS global distribution of mid-tropospheric carbon dioxide at 8-13 km altitudes between July 2003 and 2007, from the Atmospheric Infrared Sounder (AIRS) on NASA's Aqua satellite.
6145-45053329
NASA's Aqua spacecraft passed over central and southern United States on April 27-29, 2014 capturing this false-color infrared image of the slow-moving low-pressure system that spawned the strong supercell thunderstorms.
6145-45129956
These false-colored maps from ALOS 2 show surface displacements proportional to the surface motion. The arrows show the direction of the radar motion measurement.
6145-45264372
This image from the Atmospheric Infrared Sounder (AIRS) shows the temperature of clouds or the surface in and around Hurricane Michael as it approaches northwestern Florida around 3 AM local time on Tuesday, October 10, 2018. The storm shows all the hallmarks of a powerful, mature hurricane. The large purple area indicates very cold clouds at about -90 F (-68 C) carried high into the atmosphere by deep thunderstorms. These storm clouds are associated with very heavy rainfall. At the center of the cold clouds is the distinct, much warmer eye of the hurricane seen in green. The extensive areas of red away from the storm indicate temperatures of around 60 F (15 C), typical of the surface of the Earth at night. These red areas are mostly cloud-free, with the clear air caused by air motion outward from the cold clouds near the storm center then downward in the surrounding areas. Michael has developed quickly into a dangerous Category 4 storm, with sustained wind of 150 miles per hour. It is
6145-45262788
ECOSTRESS captured surface temperature variations in Los Angeles, California between July 22 and August 14 -- a period of extended heat -- at different times of day. The images show how different surfaces within the cityscape warm and cool throughout the day. They have been colored to show the hottest areas in red, warm areas in orange and yellow, and cooler areas in blue. The hottest areas are dark asphalt surfaces that have very little shade during the day and remain warm throughout the night due to their higher heat capacity. They include freeways, airports, oil refineries and parking lots. Clouds and higher-elevation mountainous areas were the coolest. More information is available at
6145-44825729
Tropical Storm Bonnie, now a depression, rakes South Florida in this infrared image from NASA's Atmospheric Infrared Sounder , en route to a weekend run-in with the Gulf of Mexico and the Gulf oil spill.
6145-44828342
STS059-S-040 (12 April 1994) --- STS-59's MAPS (Measurement of Air Pollution from Satellites) experiment is sending real-time data that provides the most comprehensive view of carbon monoxide concentrations on Earth ever recorded. This computer image shows a summary of quick look data obtained by the MAPS instrument during its first days of operations as part of the Space Shuttle Endeavour's SRL-1 payload. This data will be processed using more sophisticated techniques following the flight. The color red indicates areas with the highest levels of carbon monoxide. These Northern Hemisphere springtime carbon monoxide values are generally significantly higher than the values found in the Southern Hemisphere. This is in direct contrast to the data obtained by the MAPS experiment during November 1981 and October 1984, i.e. during Northern Hemisphere fall. The astronauts aboard Endeavour have seen fires in most of the areas showing higher carbon monoxide values (China, Eastern Australia, and
6145-58972046
Throughout the month of September 2020, NASA's ECOsystem Spaceborne Thermal Radiometer Experiment on Space Station (ECOSTRESS) imaged multiple wildfires across the state of California. The image above shows the ECOSTRESS land surface temperature of California. Multiple insets highlight a fraction of the multiple fires that have impacted California, with effects seen throughout the U.S. and beyond. The dark red spots show areas of high heat, with arrows pointing out the active fires. The contiguous California image was stitched together from multiple evening (10 p.m.-6 a.m. PDT) ECOSTRESS images from Sept 6 to 12, 2020, to generate a cloud-free statewide map. NASA's Jet Propulsion Laboratory in Southern California built and manages the ECOSTRESS mission for the Earth Science Division in the Science Mission Directorate at NASA Headquarters in Washington. ECOSTRESS is an Earth Venture Instrument mission; the program is managed by NASA's Earth System Science Pathfinder program at NASA's La
6145-45116789
This graphic indicates a similarity between 2016 (dark blue line) and five past years in which Mars has experienced a global dust storm (orange lines and band), compared to years with no global dust storm (blue-green lines and band).
6145-44965290
Groundwater storage trends around the United States as measured by the NASA/German Aerospace Center Gravity Recovery and Climate Experiment (GRACE) satellites between 2003 and 2012.
6145-44828361
This image from NASA's Aqua spacecraft shows how surface emissivity -- how efficiently Earth's surface radiates heat -- changed in several regions of Pakistan over a 32-day period between July 11 (pre-flood) and August 12 (post-flood).
6145-44725313
There has been considerable interest in the recent state of Arctic sea ice for scientific research and for operational applications especially along the Northern Sea Route and the Northwest Passage.
6145-45103249
NASA's ISS-RapidScat instrument on the International Space Station provided a look at the strong winds that led to coastal flooding in southern New Jersey during the historic winter storm that blanketed much of the U.S. East Coast, starting Jan. 23, 2016.
6145-45258905
A new series of images generated with data from NASA's Soil Moisture Active Passive (SMAP) satellite illustrate the surface flooding caused by Hurricane Harvey from before its initial landfall through August 27, 2017. The SMAP observations detect the proportion of the ground covered by surface water within the satellite's field of view. The sequence of images depicts successive satellite orbital swath observations showing the surface water conditions on August 22, before Harvey's landfall (left), and then on Aug. 27, two days after landfall (middle). The resulting increase in surface flooding from record rainfall over the three-day period, shown at right, depicts regionally heavy flooding around the Houston metropolitan area. The hardest hit areas (blue and purple shades) cover more than 23,000 square miles (about 59,600 square kilometers) and indicate a more than 1,000-fold increase in surface water cover from rainfall-driven flooding. SMAP's low-frequency (L-band) microwave radiomete
6145-44986748
Spatial distribution of snow water equivalent across the Tuolumne River Basin from April 10 to June 1, 2013 as measured by NASA's Airborne Snow Observatory.
PREVIOUS
of 1
NEXT
2401 S. Ervay, Suite 206
Dallas, Texas 75215
United States
Browse
CategoriesGalleriesFree Research
For Creators
License Your ContentSuperStock For StudentsFrame of Mind BlogContributor PortalNew Image SpotlightLicense AI Imagery
Resources
About UsLicensingTerms & ConditionsAPI AccessPrivacyPricing
Contact
+1 866 236 0087help@superstock.com Contact form
©2026 SuperStock. All Rights Reserved. -B
This site is protected by reCAPTCHA and Google Privacy Policy and Terms of Service apply.